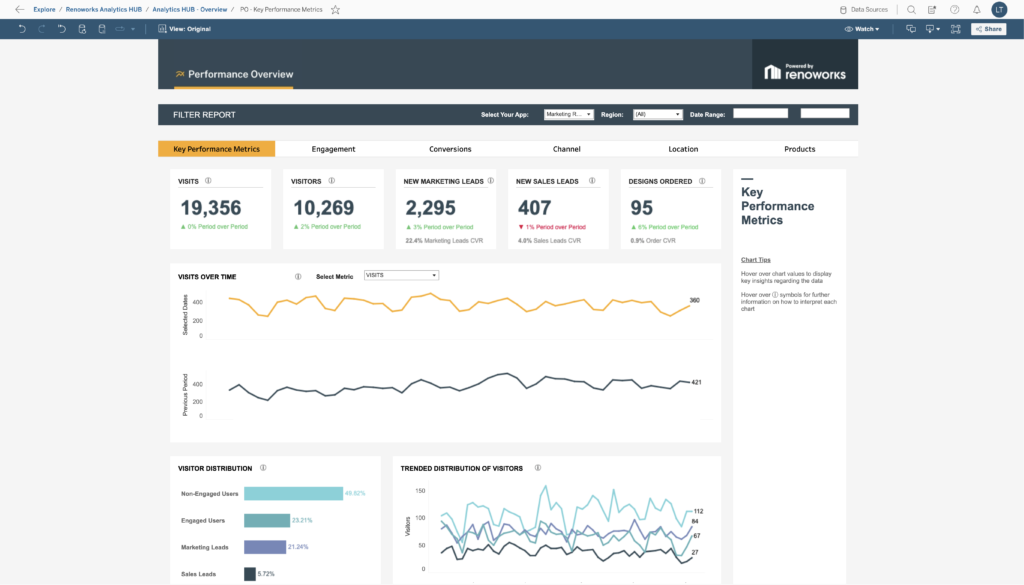
The Key Performance Metrics Tab is the best way to assess the overall performance of your visualizer.
Truly actionable insights are hard to come by – especially since you don’t have much visibility into the buyer’s journey after your product leaves the warehouse.
To solve this challenge, we’re excited to announce the launch of Renoworks Analytics Hub – a new analytics portal that will help you gain actionable insights into your customer’s buying journey and make it easy to report to stakeholders on the metrics that matter.
Understanding Our Clients’ Top Priorities
After discussions with our manufacturing clients, it’s clear that their top priorities are to:
Gain visibility into the customer experience
Better manage their leads and understand which to prioritize
Have an advanced understanding of trending products
Have insight into where their customers are located
Be able to report these findings to the right stakeholders
These were the goals we set out to address while developing the latest version of the Analytics Hub.
Renoworks Analytics Hub includes new features that allow you to gain a deeper understanding of how users interact with your visualizer.
Gain Visibility into the Customer Experience
When we asked our clients what they want to see in their analytics, the answer was clear: more information about customer experience!
You told us that you wanted more information to help you:
Determine whether users are having a good experience on your visualizer,
See where users are coming from so you can evaluate the effectiveness of marketing campaigns in different dealer regions,
Have visibility on how long users are on the visualizer
Well, we listened!
Renoworks Analytics Hub includes new features that allow you to gain a deeper understanding of how users interact with your visualizer. Here are just a few of the new features that will help you understand who is using your app and how they are using it:
Project and Lead Segmentation: Filter data by project type and lead type
Location Filtration: Identify user behavior by country, region, and city
Channel Source: Track the volume of users from various sources such as direct, referral, organic, campaigns and dealer sites.
Conversion Rate: Measure the likelihood of visitor-to-lead conversion.
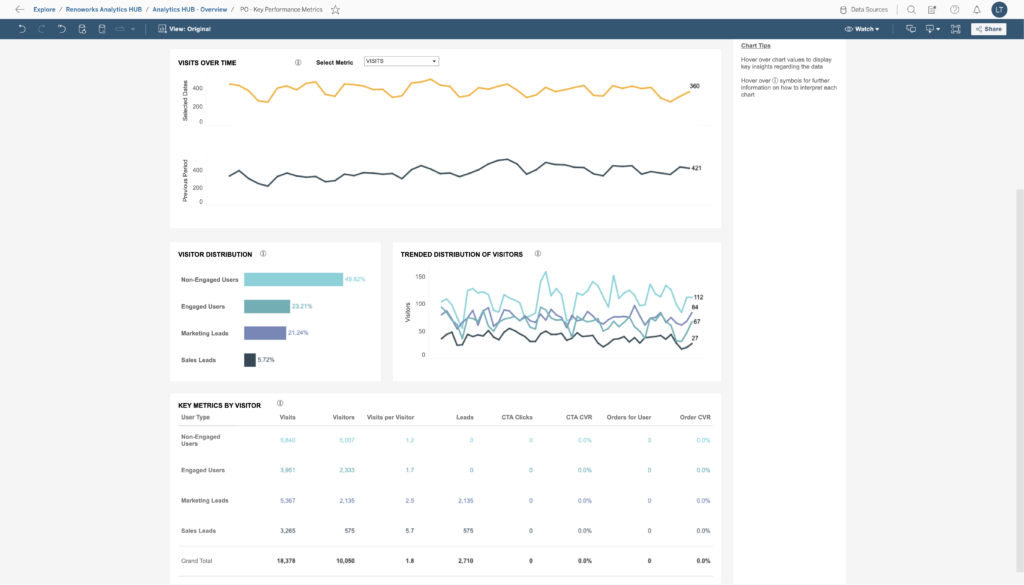
The above trend data shows you what types of visitors are using your visualizer over a set period of time.
Lead Scoring and Management the Easy Way
We recognize that the ability to generate qualified, project-ready, leads from your visualizer is important to your marketing strategy. To make lead generation easier, we’ve centralized all of your leads on the “Conversions Tab” within Analytics Hub that displays the user’s contact information. This information can be exported into your CRM for further distribution or marketing.
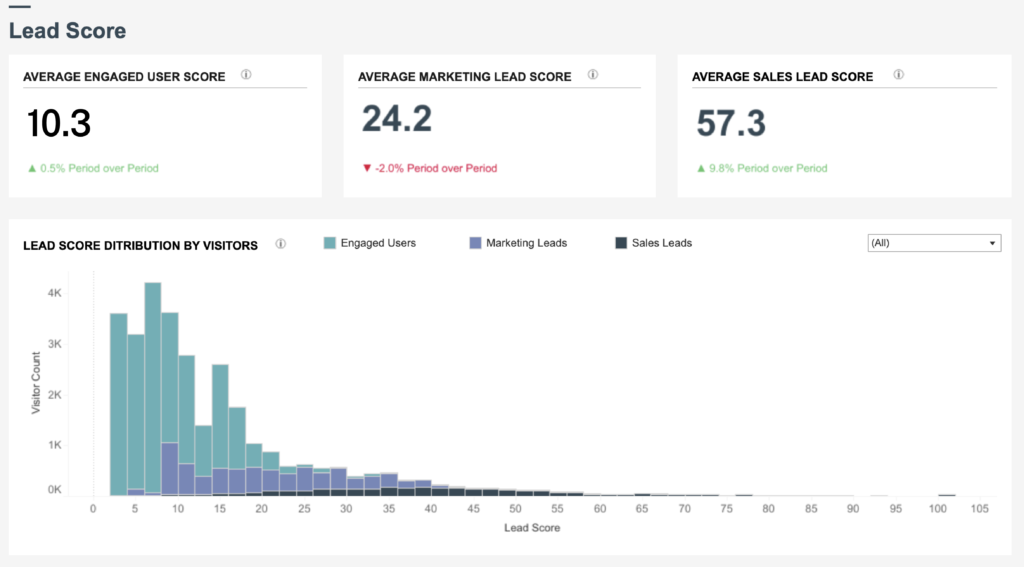
Analytics Hub Overview also gives you detailed analytics and lead scores on different lead-types such as non-engaged users, engaged users, marketing qualified leads (MQLs) and sales qualified leads (SQLs).
The "Conversions Tab" shows different lead-types such as non-engaged users, engaged users, marketing qualified leads (MQLs) and sales qualified leads (SQLs).
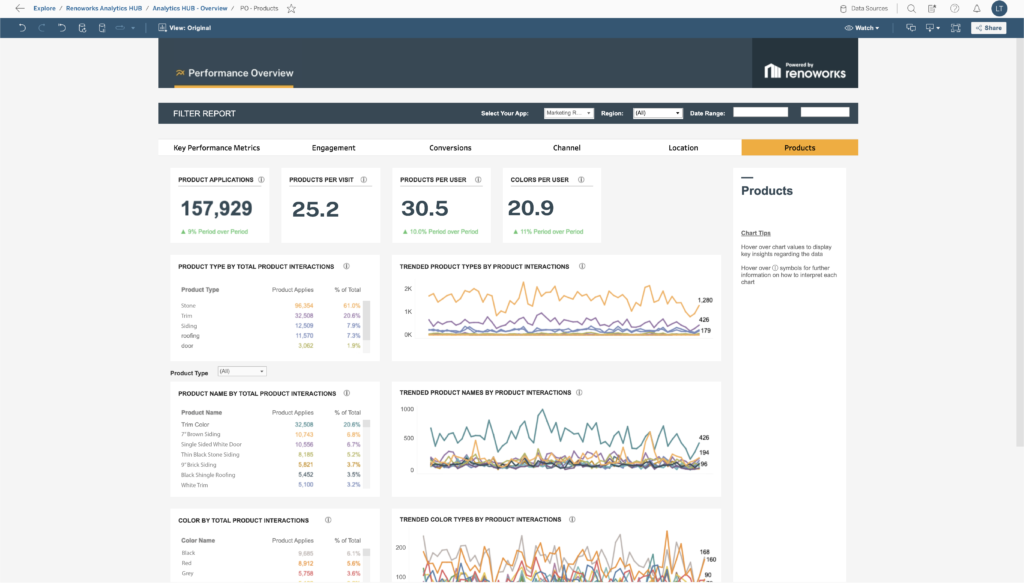
Analytics Hub answers questions Like what colors and products are most popular to homeowners in a specific region?
Advanced Product Interaction Insight
We understand it’s important to know how your visualizer users are interacting with your products. What colors and products are most popular to homeowners in a specific region? What trends are emerging in different regions and markets? These are the types of questions that Renoworks Analytics Hub answers.
Renoworks makes it easy to detect where your customers are coming from, and what products are trending in certain areas and seasons.
Here are some of the new features we’ve added to help provide the most product insights for marketers and their product development team:
Regional Segmentation: Filter product data by specific regions to identify trends in different markets and areas.
Product interaction: View a list of the most popular products on your visualizer broken down by interactions and % of total interactions.
Filter by Product Type and Product Name: Drill down into deeper product insights by filtering by the type of product (e.g. stone, siding, roofing etc.) and the specific product name (e.g. 3” duchlap, architectural shake etc.)
Product Color Filter: See how color popularity changes over time and region for each product type.
Filter by product configuration: See the most popular types of doors and other configurable product over time.
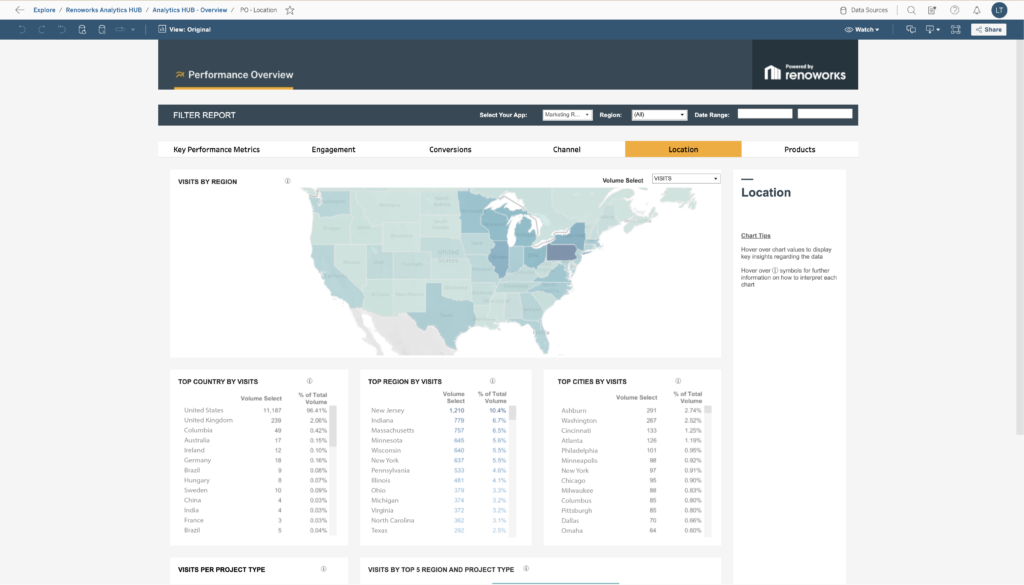
The "Locations Tab" contains a geographic hotspot map so you can see where your visitors are coming from
Geographical Targeting
Many of our clients tell us that they want more insight into homeowner and product design behavior within certain geographic markets. We think it’s so important that we created an entire “Locations” dashboard within Analytics Hub to give you deeper information on user behavior segmented by location:
Here are a few features we’ve included to help you understand where your customers are coming from:
Region Filters: Filter all Analytics Hub views by region to pinpoint your analytics
Project Type Filters: View how many project types are coming in from specific areas.
Geographic User Type Segmentation: Analyze user behavior by region, including the visits and conversion rates of users in different cities, areas, and markets.
Reporting Made Simple
As a busy marketing professional, we know that you need a simple tool to view data and report quickly to stakeholders. That’s why we streamlined the user interface of Analytics Hub to be as user-friendly as possible. We also included features such as automated email reporting, PDF and PowerPoint downloads to make reporting a breeze.
Modernized User Interface: The UI of Analytics Hub makes it easy to quickly find the data you’re looking for and impress your team members by presenting data on a modern looking user interface.
Automated Email Reporting: Set up email subscriptions and Analytics Hub will automatically email customized reports to you on a set schedule. Want summarized visualizer data sent to you every Monday morning to review while you enjoy your coffee? Analytics Hub makes it happen!
Report Format Download: Download specific data views as an image, PDF or PowerPoint presentation so you don’t need to spend hours putting together a report for your stakeholders.
Ready to Get Started?
Turning analytics data into actionable insights for your marketing and business objectives isn’t an easy task. Renoworks Analytics Hub makes your life easier by providing you with a deeper level of insight from your visualizer and makes it easier to report to your team and senior stakeholders. Book a meeting with your Renoworks Customer Success representative to get started with Renoworks Analytics Hub today.