These three visualization data insights suggest that recovery for our industry may happen sooner than we think
…over 2 million unique users a year […] are frequenting our network of online Renoworks powered visualization solutions.
Based on 2019 data across the Renoworks Network
Despite the uncertainty surrounding the impact of COVID-19 on the remodeling industry, data from the Renoworks Visualizer Network points at recovery in our industry.
These observations into the trends in the industry come to us from over 2 million unique users a year across various product-segments, including roofing, siding, windows, doors, coatings, masonry, tile, K & B and more, who are frequenting our network of online Renoworks-powered visualization solutions.
…over 2 million unique users a year […] are frequenting our network of online Renoworks powered visualization solutions.
Based on data across the Renoworks Network
This provides us with a large sample size from which to derive observations about homeowner and contractor behavior as it relates to repair and remodeling across North America.
In this article, we reveal three data observations from our platform that support a positive outlook for the building product industry.
NOTE: These insights are taken from observing the entire network of Renoworks visualizers and do not reflect the performance of every individual application. Trends will vary based on product category, region, and user-type, as well as other factors.
Here is what we are seeing:
1. THE “M-CURVE” HAS SHIFTED
Many of our client relationships have stretched years.
This gives us historical data that enables us to establish a baseline trend for the entire industry.
Historically, the most common industry trend is a significant spike of project planning in April, followed by a dip over the summer vacation months and another peak of activity in August.
We call this baseline trend the “M-curve.”
This pattern appears year over year, allowing us and our clients to plan marketing campaigns and target promotional activities at the perfect times.
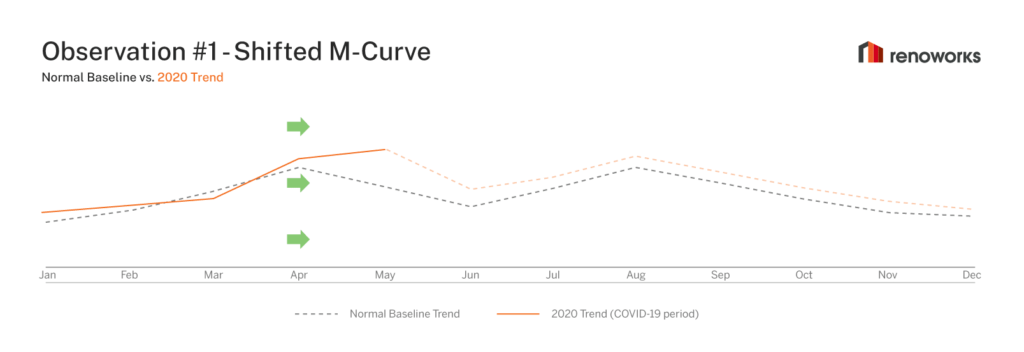
But today we are finding another use for our M-curve data: to observe the effects of COVID-19, observe any evidence to recovery in the building product industry, and understand when that may emerge.
From our observations over March to May 2020, visualization activity did not drastically dip in May, as the M-curve would historically predict.
Instead, we observed a “shifted” M-curve, where the peak was observed in May instead of April.
…this trend suggests that there is a growing amount of 'pent up demand' that may translate into more remodeling activity later in the year.
What does it mean?
After stay-at-home orders were issued in March this year, users are continuing to visit visualizers. Late April to early May 2020 saw upward trends resulting in a more consistent stream of project-planning behavior over the Spring months.
There are several possible reasons for this:
- Pent up demand from the slowdown and uncertainty in March is shifting to May and beyond
- The usual seasonal “May dip” in project planning is not behaving as normal because homeowners are delaying their Spring/Summer vacations or foregoing them entirely
- Homeowners are taking advantage of their time at home to plan for improvements, and perhaps reallocating canceled vacation budgets to home remodeling projects
Based on this trend, it appears the impact of COVID-19 hasn’t blunted planning activity for home remodels, suggesting that there is a growing amount of “pent up demand” that may translate into more remodeling activity later in the year.
2. HIGHER ABSOLUTE NUMBERS
In addition to the shifting of the M-Curve, we are also witnessing more traffic to visualizers in the aggregate.
Although there was a slight decrease in March with the onset of the COVID-19 crisis, the majority of our clients’ visualizer platforms are seeing large spikes in growth over last year starting in April.
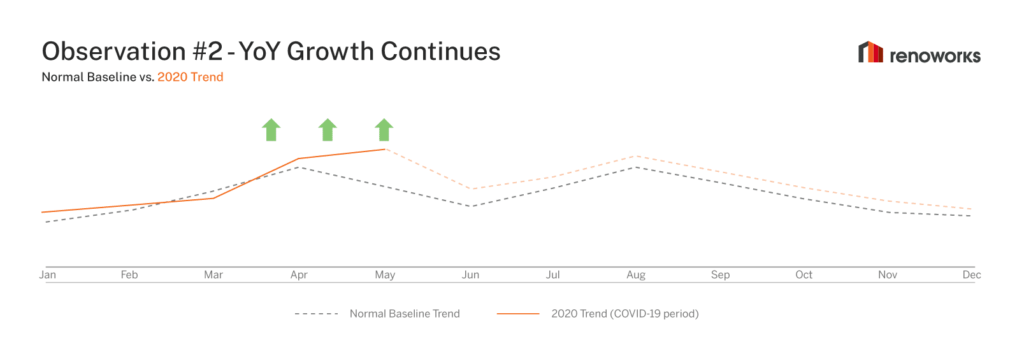
Contractors are using virtual selling techniques more frequently to close jobs remotely.
What does it mean?
This is evidence of more project planning activity in April and May than previous years across the Renoworks Platform.
Here are some possible causes of this spike in activity:
- Now that homeowners are forced to use their homes for work and family life, they are putting more focus on planning updates to their residences to suit their new lifestyle better
- Homeowners are spending more time online and using home visualization tools more frequently as a result
- Contractors are adopting virtual tools at an accelerated rate due to the need for social distancing, which has resulted in higher visualizer use as the trend turns towards virtual selling tools
Contractors are using virtual selling techniques more frequently to close jobs remotely.
Recent discussions with our contractor network reveal that they are using virtual selling techniques more frequently to close jobs remotely, and they are adapting business processes for an increasingly digital sales environment.
The overall increase in visualizer usage again suggests that homeowners are planning their remodeling projects in unprecedented numbers and maybe an indicator that this planning activity could turn into economic activity in the near future.
3. LOW BOUNCE RATES AND HIGH ENGAGEMENT RATES
A “Bounce Rate” is the percentage of users that visit a website and don’t take any further action (i.e., they “bounce” off the homepage right after visiting). A lower bounce rate is best because it indicates that users are having a more relevant and valuable experience.
“Engagement Rate” is the amount of time users spend interacting with products, projects, and design in the visualizer app.
Higher Engagement Rates typically signifies that a user is more engaged or closer to a purchase decision because they are designing a photo of their own home.
Building Product marketers are familiar with these metrics as they reflect the relevance in their messaging and the tools they provide.
From March to May 2020, the reduction of bounce rates was 20.1%, lower than the typical seasonal decrease in bounce rates for the same period.
Additionally, Engagement Rates were 10.3% higher than the healthy increase in Engagement Rates that usually occurs in the March to May period of the same year.
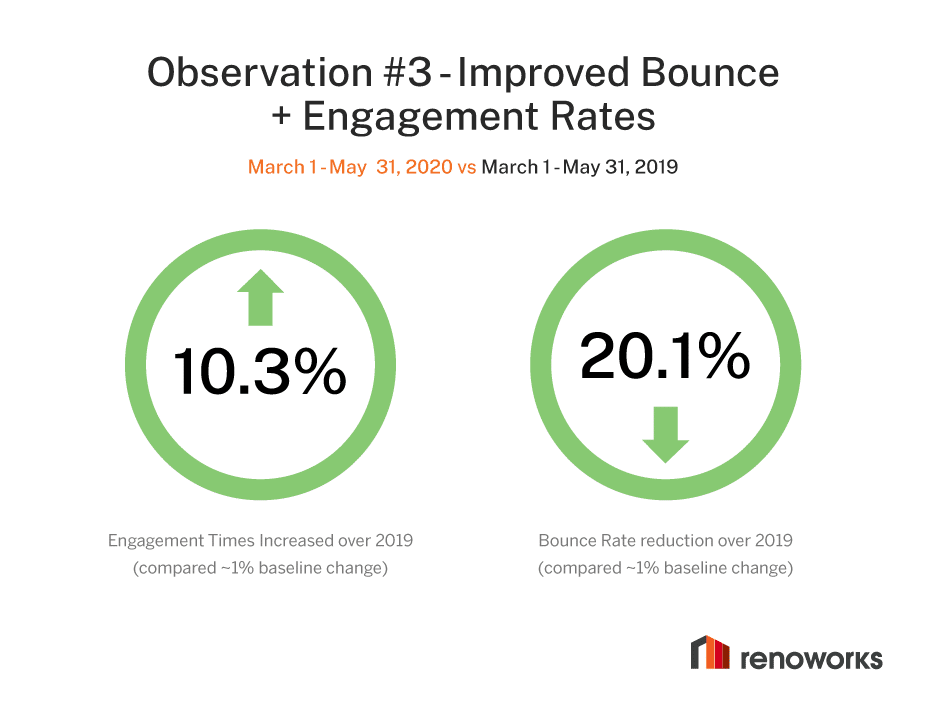
Homeowners are being more active with their projects.
What does it mean?
The increase in usage is directly related to homeowners being more active with their projects. We also know that manufacturers are more proactive in communicating with their audiences, which is resonating with customers and attracting them further.
Homeowners are being more active with their projects.
In a world where customers cannot easily visit a showroom and look at physical samples of products, manufacturers have adjusted their promotion activities to provide more virtual engagement opportunities. The trends seen in visualizers show that this strategy is resonating and will continue to be a relevant part of their plans for the rest of the year.
In addition, for contractors who can no longer attend in-person sales visits, visualizers are becoming more relevant and valuable as virtual sales tools to keep their businesses going, which is another reason for the improved engagement and bounce rates.
These few insights bode well for a recovery in our industry as it shows that project planning and design activity is still strong, albeit in a different form.
Want to learn more about Renoworks analytics?
Click here.
Already an existing Renoworks customer? Contact us at customersuccess@ renoworks.com to learn how you can optimize your platform for 2020.
FINAL THOUGHTS
Economic activity in the remodeling and building products industry may have slowed, but our data shows that project planning and design activity has increased as people spend more time at home and focus more energy on how they will improve it to fit their “new normal.”
We believe that this is an indicator of pent up demand for remodeling services, and we will soon start seeing the economic impact of that demand when stay-at-home orders are relaxed over the summer and homeowners start moving toward a sense of normalcy.
The result should result in consistent demand for building products over the summer months and beyond.