Learn what these three metrics can tell you about your customers and your marketing strategies.
Today’s marketers are collecting data in many ways. Services like Google Analytics, Matomo, Hotjar, Pardot, Eloqua, Marketo, Hubspot, and many more provide an unprecedented amount of information on website visitors.
But interpreting all that data and figuring out what it means to your marketing strategy can be time-consuming and overwhelming.
We want to change that!
When it comes to Renoworks visualizer analytics, we’ve talked with hundreds of building product companies to create a dashboard that tracks the metrics that matter most to your building product marketing strategy.
Here are just three of the most important metrics to look at in your Renoworks analytics, and why they are important to track, measure, and improve.
Users who upload a photo of their home spend anywhere from 20% to 300% more time on your visualizer.
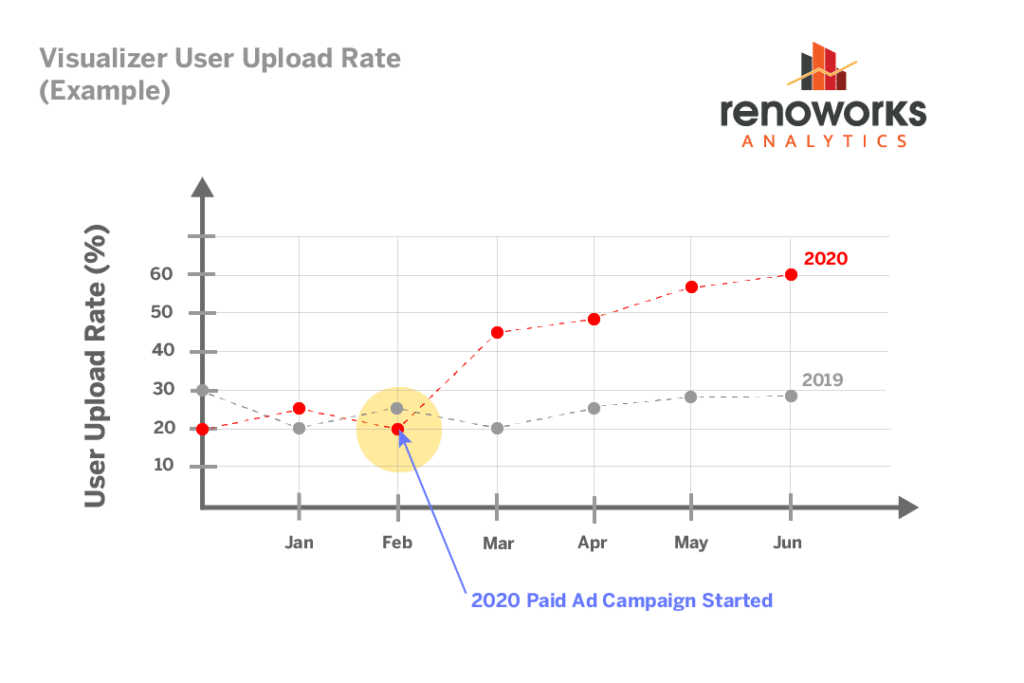
Metric #1: User Upload Rate
Traffic to your visualizer is important, but it doesn’t tell the entire story.
It’s much better to focus on User Upload Rate instead, because it’s the clearest indication that users are getting value out of your visualizer and engaging with your products.
User Upload Rate is the percentage of total users on your visualizer that uploaded an image of their home to design with your products.
This metric is important because users who upload a photo of their home spend anywhere from 20% to 300% more time on your visualizer.
We think that’s a good thing for two reasons:
First, it shows that users are getting value out of your Renoworks visualizer by using its core functionality – the ability to see exactly what their own home will look like with your products installed. This is one of the first stages in a purchasing journey that prospective customers take before buying your products.
Second, image uploads translate into a higher propensity to buy your products.
According to our NPS survey data for Renowork Design Services uploads, 20% of homeowners responded that they actually installed the products used in their design, with another 60% responding that they were “very likely” to purchase the products used in their design.
This data shows that up to 80% of users who upload an image through Design Services will go on to purchase your products!
Although this data relates specifically to Design Services uploads, we can infer that “regular uploads” should also have an impact on the user’s propensity to buy your products as well (which we are happy to confirm by working with you to survey your visualizer users).
To see your User Upload Rate on your Renoworks Enhanced Analytics dashboard, look at the “Key Indicators & Leads” tab.
These are users who have signaled their intent to undertake a remodeling project by using your visualizer, and are very qualified leads as a result.
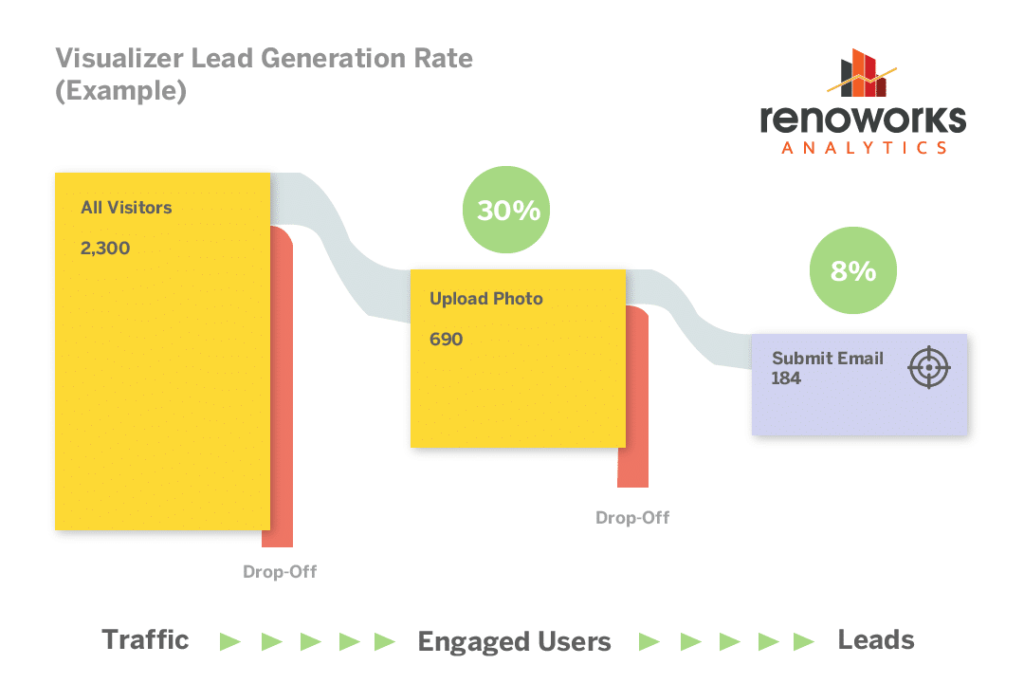
Metric # 2: Lead Gen Rate
After a user uploads a photo, how can you move them further along their purchasing journey?
Many of our clients want users to submit their contact details so they can be distributed to sales reps or contractors, or they can be put into marketing email sequences to nurture the user and move them closer to a purchase decision.
The value of generating leads through your visualizer is obvious.
These are users who have signaled their intent to undertake a remodeling project by using your visualizer, and are very qualified leads as a result.
If you can put them in touch with a preferred contractor or provide helpful information via email marketing, then you can increase the chances they will purchase your products.
The Visualizer Leads report on your Enhanced Analytics Dashboard shows the total number of leads generated from your visualizer.
The report also contains a real-time list of the leads with their contact details so you can manually segment and follow up with them if you don’t have an automated CRM integration with your visualizer.
This metric is important because it measures the percentage of users who are ready to move on to the next stage of their purchasing journey by contacting one of your preferred contractors or getting a quote.
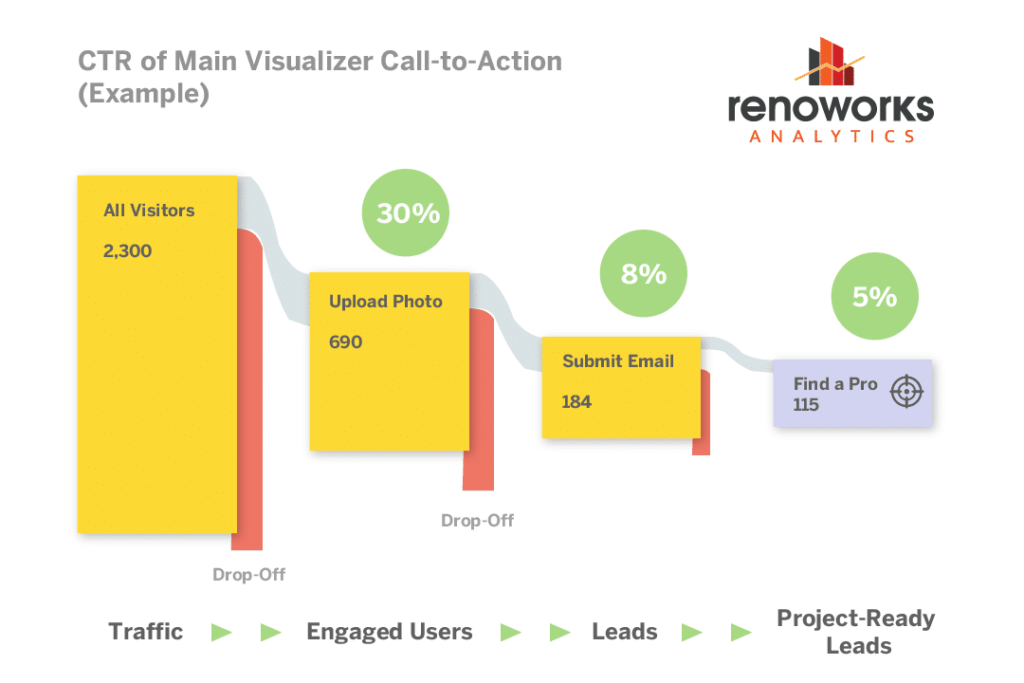
Metric # 3: CTR of Main CTA
What do you want users to do after designing their home on your visualizer?
Your goal might be to get them to “get a quote”, “find a pro”, or “find out where to buy.”
Whatever that goal might be, it should be prominently featured as a persistent call-to-action “CTA” in your visualizer.
Click-through-rate (“CTR”) of the main CTA on your visualizer is another important metric we highlight in your Renoworks Enhanced Analytics Dashboard. It measures the percentage of users who go on to the next stage in the purchasing journey and click on your main CTA.
This metric is important because it measures the percentage of users who are ready to move on to the next stage of their purchasing journey by contacting one of your preferred contractors or getting a quote. These users are highly qualified and more “project ready” from a sales perspective because they are ready to make a purchase decision.
Summary
By looking at these 3 key metrics, we can help you dive deeper into the analytics to see what your prospective customers did before they clicked, who they are, where they came from, and much more. This allows you to generate more leads, identify insights about the purchasing journey of your most valuable users and, ultimately, attract more of those users and help move them to a purchasing decision more quickly.
Interested in diving deeper into your Renoworks analytics and discovering opportunities to optimize the conversion rates for the above key indicators? Or maybe you would like to find out how to activate your Enhanced Analytics if you don’t have it already? Contact your Renoworks customer success rep and set up a meeting.